ERI highlights new research and tools during online summit

By: 

Indiana University’s Environmental Resilience Institute (ERI) hosted its biannual data summit on May 21 to share affiliated researchers’ new research and tools. The summit included presentations on urban green infrastructure, how the pandemic has influenced Hoosiers’ attitudes on climate change, how farmers think about resilience, and an overview of the ERI Data Platform.

“From the beginning, environmental data has been a cornerstone of ERI’s mission to help Indiana address environmental change,” said Gabe Filippelli, ERI’s executive director. “The research and data presented at this spring’s summit showcased the myriad ways information can be applied to make decisions when tackling issues related to climate change in Indiana, such as city planning and farm management.”

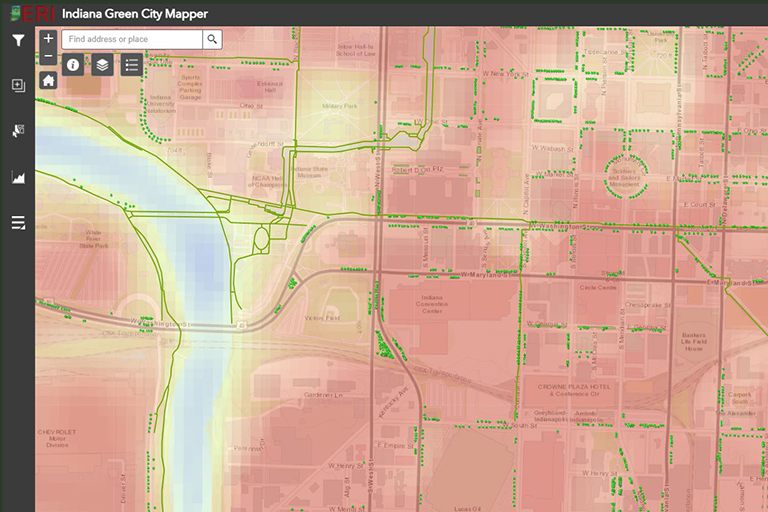
Kicking off the summit, Hannah Gregory, an ERI research associate, discussed the new Indiana Green City Mapper (IGCM), a statewide spatial inventory that tracks six forms of green infrastructure—urban forests, green roofs, parks, greenways and trails, urban food gardens, and green stormwater infrastructure—and pairs this information with socioeconomic and climate change-related data to help inform resilience planning.

A screenshot of the Indiana Green City Mapper map displaying data related to trails, trees, green stormwater infrastructure, and land surface temperatures in downtown Indianapolis. Users can select from 16 different data layers within the tool.

One data layer included in the mapper displays local climate zones, a classification system for documenting temperature variations in urban settings. Indiana University Assistant Professor Dana Habeeb explained that temperatures can vary dramatically within a city due to infrastructure and land cover. Local climate zones can give city planners an idea of where populations might be most vulnerable to climate impacts, such as high heat. To determine these zones, Habeeb and her colleagues identified sites in Marion and Monroe counties, conducted temperature readings, and ran multiple models to get an accurate assessment of the microclimate in the study areas.

Building on the Green City Mapper, Ph.D. student Stephanie Freeman-Day presented on how urban forest management in Indiana can help prepare Hoosier communities for climate change and guide the transition of forests to a warmer climate. To better understand communities' preparedness, Freeman-Day and the IGCM team developed a municipal urban forest resilience index that analyzed how communities are managing their urban forests.

Additionally, postdoctoral researcher Samantha Hamlin used the mapper to illustrate the inequality of green infrastructure in Indianapolis. According to IGCM data, communities with lower incomes and communities of color possess less green infrastructure and less species richness and diversity than white, wealthier communities. This disparity exists despite residents of communities with lower incomes being more vulnerable to extreme heat, which green infrastructure can help address.

The summit also featured a talk by ERI Research Fellow Matthew Houser on preliminary results from the Hoosier Life Survey 2.0. Houser and the Hoosier Life Survey research team conducted a follow-up survey in 2020 to assess how Hoosiers' views of climate change and resilience have changed since the pandemic. While noting the preliminary nature of the results, the team found Hoosiers heard less about climate change in the news in 2020 but were more likely to believe climate change is happening compared to the previous year. Further analysis indicated that gains in belief can be attributed to Hoosiers who identify as Republican.

In the final research presentation of the summit, IU research technician Rachel Irvine discussed a National Science Foundation-funded project studying agriculture through social and biological lenses. Through interviews with Midwestern farmers, Irvine is documenting farmers' management practices and attitudes toward soil health, water management, the future of agriculture, and climatic conditions.

Concluding the event, ERI Data Manager Justin Peters demonstrated the ERI Data Platform and how researchers can utilize it. Peters went through the various basemaps and datasets that have already been integrated into the platform while also showing researchers how they can bring in their own data for analysis.

Watch the Data Summit

Description of the video:

>> Okay, hi everyone, can you all hear me? Great.
>> Yes.
>> Good morning everyone. My name is Justin Peters. I am the data manager for the Environmental Resilience Institute at IU. This is our fourth ERI Data Summit that I've hosted in that capacity, and I wanna thank you all first for registering and attending today.

We have quite a bit more attendance than we have had in the past. We've opened this event to the public in the past and has primarily been ERI affiliated researchers that have taken place on this summit. So it's great to have some additional participation from those that may not have attended these in the past.

We have some great presentations lined up within the next couple of hours as you can see in that schedule there. I think everybody should be able to see that schedule. We do have one change to the schedule, the urban green infrastructure, the food security edible trees and equity in Bloomington and Indianapolis, that was to be presented by Erin Hartman and Ava Hartman.

We've got another speaker lined up at a presentation and I do not remember the title of that presentation but Dana Habib will be presenting and she'll be able to provide that title here moment. So to kick things off, I am happy to introduce the new ERI co-directors of Gabe Filippelli and Sarah Mincy for some opening remarks before we start the presentations.

So Gabe, the floor is all yours.
>> Great, thanks Jeff, and good morning everybody. This is gonna be a great set of talk so I look forward to understanding as well. Sarah and I started off as directors just about a little over a month ago, and we're super excited.

ERI's in this amazing place where we're really able to highlight the data that we've been able to get now from funded research, and start to think about how to implement that data, both for research practices and also for teaching and community impact purposes. So I think that's what we're gonna see a lot today, and what I think is kudos to Justin in the data team for pulling together some platforms, really thinking through how to make data both discoverable and sharable and viewable and accessible to all.

Sarah and I when we came in, we have a commitment to supporting ERI as it's already been going which is extremely successfully. But also thinking of adding a couple components, including having ERI perhaps embed a little bit more deeply in the curriculum mission of the Indiana University as a whole, as well as making sure that we keep an equity lens on much of what we do.

And some of the talks you're gonna see will clearly have that equity lens and I think it's an exciting time to be associated with ERI. Everyone's talking about the environment and climate and the critical nature of that as well as how it intersects with equity. So, I was so thrilled to take this position and I'm also so thrilled to have as my co director, Sarah Mincy, who will transition us to the next phase.


>> Thank you, Gabe. Yes, I'm pleased to be here too. Thank you Justin for the introduction. Thanks Gabe for those comments. I think you're right, we're going to see a lot of our presentations today focus on data that will support both of those new missions. A lot of the data is gonna be unavailable for teaching resources I think, for faculty at IU, but educators beyond IU, and the equity focus is certainly going to be present today, so it's exciting.

I'm a researcher within the first group of presentations, the urban green infrastructure group so I'm really pleased to transition to introduce this group of fine researchers. We're gonna have four different presentations that will give you a really good lens on a product that our group has produced called the Green City Mapper, and, first up will be Hannah Gregory, who is a research assistant with our group.

She graduated a few years ago from IU from the environmental science program and she has worked across the university and in multiple roles but we've been happy to have her as a research assistant with the urban green infrastructure group. Next up will be Dana Habib. Dana is a professor in School of Informatics, Computing and Engineering and she's gonna talk about urban heat and how we can deal with that.

Following Matt, I think we will have Stephanie Freeman-Day, a PhD student who has been working with me in urban forest management and on social ecological systems. And she's gonna talk about a part of the mapper that focuses on more of the social and institutional data, sort of the management and planning side of urban forestry.

And then, Samantha Hamlin, who is a postdoc with the UGI group will talk and she's gonna give us a good overview of how we can start to apply some of the wonderful datasets that we've collected in the mapper. So with that, I think I will turn it over to Hannah.

Hannah, I think you can share your screen and take it away.
>> Okay, so thank you for the introduction Sarah. Just a little more background on me. As I said, I graduated from Sofia in 2019 and I previously worked as the environmental practices coordinator for IU landscape services.

And the biggest project that I worked on and completed was the 2019 campus tree inventory and the related analysis with that. I've been a research associate with the ERI's, UGI and urban forests group for a little over a year now, and my primary role has been developing and updating the Indiana Green City Mapper, which I'm going to be reviewing for you today.

So the purpose of the Indiana Green City Mapper was to condense research from the ERI and from other existing sources related to socioecological and climate data into a single source that's interactive and easily accessible and also user-friendly. City governments can use this Indiana Green City Mapper as a resiliency planning tool to prepare for impending climate challenges like heat stress and flooding, and can also help them address community needs such as food insecurity and access to green spaces.

Community members themselves can use the mapper to equip them with the knowledge they need to encourage the change that they wanna see in their communities, and also for personal use and of course the mapper is going to be beneficial for other like-minded researchers wanting to do similar work.

The three main data types that we have represented on the mapper is urban green infrastructure, social and climate data. So under the urban green infrastructure, there's six subgroups, forest, food and agriculture, stormwater, green roofs, parks and trails and greenways. And in the social data section, we have socioeconomic indices, food deserts and urban forests, climate change planning layers, and lastly some examples of the climate related data that we have represented on the map are urban heat island intensity, local climate zones, and building height data.

Due to the proximity of our researchers here in Bloomington and IUPY most of the data does have an initial spatial focus that's limited to Marion and Monroe counties, with the exception of urban forest data, which does span across the entire state and is really comprehensive. But we do have plans to expand spatially moving forward.

So we're gonna start with a quick platform overview, this is just a screenshot of the platform when you first land on it. So you have the typical map elements of the Zoom bar, the layer menu, and the legend. And then there is a platform directions window, which I strongly encourage you to read before using the platform.

It'll help show you how to use the widgets and give you some more in depth descriptions. There's an attribute table at the bottom that you can pull up to view the corresponding attribute table to the layers that you have on the map. And then to the left there's a widget bar, and I'll be talking about the widgets here shortly.

So this is an example of the map once you've added some of the layers. So you can see the layers on the map as well as the corresponding legend and the attribute table at the bottom, which is pulled up. And as you select the data points in the attribute table, they're highlighted on the map.

There's the widget bar to the left, which is open to the filter widget. And yeah, so now I'm gonna talk about the widgets. So the widgets were created to kind of help customize the user's experience when using the platform and to make the data more interactive. So we have a filter widget which has some preset filters that focus on a certain field attribute across several different layers.

And also allows a user to create their own filter. There's a group widget that includes changing basemap and adding data, so users can change the basemap to aerial imagery. Or any of the other bases that are in the ESeries basemap gallery. And they can also pull on their own data that's either housed in ArcGIS online or in a file on their computer.

There's a selection tool, and the selection tool can be used to export data based on the user's selection. And it can also give some quick statistics and highlight data. There are some pre-made charts that the users can execute. And also some basic info summaries that can summarize the number of points as you zoom in and out of the map.

The tree inventory, since it is so complex and data heavy, it has a few widgets to itself. There's a size infographic and diversity infographic and also another summary of the diversity indices and other information that we've conducted on the tree inventories. And there's more widgets to come as more data is added to the map.

In the layer menu, there's some options to change the transparency and visibility range of each layer. And rearrange them by moving them up and down to create a more customizable map experience based on what data you want to be viewing. And the show items detail button links out to the layers Information page in ArcGIS Online.

And there you can find a more in-depth description of the layer. And soon you'll be able to find the metadata that attaches to the layer as well, which is in the process of being uploaded. You can also export the data from that page as well. So I wanted to show a quick example of the Indiana Green City mapper in action to jog some ideas on how it can be used.

We're going to look at the patterns between urban gardens, urban heat island intensity, and urban canopy cover in central Indianapolis. And also pull in some additional data that maps Brownfield locations in downtown Indy. And just to recognize a caveat, these observations are just for the purpose of being an example of identifying data patterns.

And they haven't been analyzed past this first step and spatial quantitative analysis would need to be used to confirm or assess the significance of the patterns. So the map on the left is a screenshot of the Indiana Green City mapper. It has the urban heat Island density map, the canopy cover.

And then the blue points are the urban agriculture and gardens. And on the right, there's an urban agriculture and garden points, and it's layered on top of the land cover zones. And the red and orange scale represents developed areas. And similarly the red areas in the heat intensity map represent heat stressed areas.

So the pattern that we can recognize is that urban agriculture and gardens are mostly found in developed areas with higher canopy cover and more outside of downtown. And the higher heat index corresponds to less canopy cover and less urban gardens, as you can see in the especially the central downtown area.

So this is the same two maps, but instead of the urban agriculture, it shows Brownfield locations. Just give you a second to look at that. So the Brownfield areas are super dense in downtown Indy, and that also corresponds to more heat stress, lockup canopy cover, and fewer garden locations.

So the Brownfield's might offer an opportunity to increase canopy cover by planting more trees. Decreasing heat stress by means of planting trees and increasing canopy cover, and also provide spaces to develop urban gardens. So in this way are using the Indiana Green City Mapper in this way helps to identify solutions to these emerging climate and socioecological issues.

And can help cities begin to answer important questions like what areas need more trees planted to eventually reduce heat stress, especially as the climate changes? And is there a vacant land that could be used to address food insecurity? So we're beginning to turn our focus towards how we should update the platform.

And we're welcoming some ideas on best practices on how to do that. So if you have any insight that you'd like to share, feel free to shoot me an email. We also have the goal of spatially expanding the data layers that we already have, as well as eventually inviting new data that we don't have are presented on the map yet.

We already have some funding for this through the DNR and the Institute for Advanced Study. And we're working on securing more. Please feel free to reach out to me if you have any questions. And thank you for your time. I don't know if I have any time to answer questions at this point.


>> But I think what we were gonna try to do, Hannah, is hold on questions. Maybe we'll get through the presentations and then-
>> Okay, perfect.
>> Yeah, yeah. But thank you so much for that presentation. As you can see, and as Hannah suggested, the Green City Mapper is really framed by resilience theory and socioecological systems theory.

We're really interested in trying to link up this variety of data to try to think about how as we move forward and experience climate change, how can we help mitigate that? And how can we help people adapt and identify problem spots, but places where there are opportunities like Hannah just showed.

So next up is a little bit more on that topic with Dana Habeeb. Dana, I'll turn it to you. There we go, I was muted. Thank you Hannah for that great presentation of showing our data platform. So what I want to do now is actually take you through one of the climate variables that we have.

And so we saw a lot on some of the urban heat island intensity and a little bit local climate zones. So I just want to right now take a little bit of time to describe what are local climate zones, how do we create them, and how can they be useful.

So just a little bit about myself. I'm an assistant professor here in IU at the Department of Informatics. My background is in urban design and environmental urban planning, focus on urban climatology. And my research is really centered on how the built environment impacts climate change and climate change impacts the built environment, strong focus on extreme heat and that impact community health.

It's been a pleasure working with this great team to develop this platform. As we see with extreme heat, more people die to extreme heat in the United States than any other natural disaster. And we see that cities are particularly vulnerable to extreme heat because of what's known as the urban heat island effect.

The urban heat island effect occurs when we see that temperatures are higher than their surrounding rural areas. And this temperature differential is due to basically how we're designing and building cities. We're displacing natural vegetation, and replacing it with impervious surfaces such as buildings, roads, and parking lots. And all that goes to elevate temperatures in cities.

We don't just see a difference between urban and rural when we're looking at the urban heat island effect, but we actually see that temperatures vary dramatically within a city. And so we can see temperatures increase by as much as 25 degrees Fahrenheit within one city. And so it was really important for us to be able to identify these microclimates and understand those heat exposures for these specific areas as well as the communities that live there.

So urban climatologists have developed what's called these local climate zones, which are basically these urban formed topologies. And they're derived by specific urban form parameters that we know impact and drive temperatures. And so we can imagine a downtown area in Indianapolis is gonna be a lot hotter than a residential area.

And so this work really goes to be able to identify those areas. And so the local climate zones are actually divided into two main categories. They're divided into the build type and then land cover type. Within build type, we see examples like compact high rise, like we would see in a downtown area, or a more sparsely built area that we see more on the edges of cities.

There are six main parameters that go into defining the urban heat island, the local climate zones. The first two are sky view factor and aspect ratio. Both of those are dealing with the urban morphology of the city, and really capturing or addressing measures that capture and retain heat in cities.

The sky view factor is the percent of the sky that is visible from the ground. The aspect ratio is a ratio between the height to width ratio of a street canyon. And then we have more land cover variables, like impervious surface fraction, which is dealing with the percentage of impervious land cover impervious in an area as well as the amount of building surface that is in an area.

And the last variable is height of roughness, which is really dealing with the average building height and as well as vegetation height. So for our data platform, we classify local climate zones for both Bloomington and Indianapolis. We did a supervised classification using a random forest model. And basically, what we did is we identified training sites for each of the local climate zones for both Bloomington and Indianapolis.

We wanted to compare this classification approach to three different models to kinda see what would result in the best approach of doing this classification. And we did the majority of all the classification in Google Earth Engine. So for our urban form parameters that we actually used too in one of our models is that we used aspect ratio, calculated that as well as buildings surface fraction, impervious surface fraction, pervious surface fraction and roughness height.

Specifically, we used the statewide LIDAR data to estimate the average building heights for each of our zones as well as average vegetation height. And what we actually determined was that these two last ones, roughness height, were the most important variables that we added into our models. So here's an example looking at Bloomington was classified based on local climate zone.

And we can see what we'd expect, the more intense development happening in the center of Bloomington. And then towards the edge we see more of the sparsely built and the open low rise. We have approximately for an 88% accuracy with our local climate zone classification for Bloomington. And here is an image for Indianapolis looking at our local climate zones here.

We again see the more intensity of development with compact high rise, compact mid rise, all happening in the downtown area for Indianapolis. And our model here was upwards of 94% for our accuracy. And this is important again for communities to be able to identify areas are gonna have the highest heat exposures, but also to be able to identify which urban form parameters are actually driving these temperatures.

Cities can then really, by understanding which urban form parameters are driving temperatures, they can then target policies that are appropriate to those levels and those microclimates, in order to reduce those temperatures. And so moving forward, what we'd like to do is we'd like to do a classification for the state of Indiana.

And so there's a big movement right now to do these local climate zones across the world and to share the mapping and the classifications on a data platform. And so one of the recent classifications have been for a much larger scale across the entire United States. And so we investigated the United States classification and compared it to our model.

And was able to show that these very large regional models are actually not as effective for Bloomington and Indianapolis. And that really what we're determining that's really separating this is that we just don't have enough training sites or they didn't have enough training sites in order to really train those models.

So developing those local training sites is really important. So moving forward, this is our first attempt at looking at doing the statewide for Indiana. We will be selecting the correct model to be used. We'll be adding additional training sites. We'll add additional satellite data by using Sentinel 2.

And then we're also gonna be using a normalized digital height model from the state that's generated from the statewide on LIDAR data set in order to move forward with our work here. Thank you so much.
>> Thank you, Dana. That's such fascinating work. And obviously, it's gonna be a really big resource once we've got it for the state.

It's amazing. We are going to transition over now to Stephanie Freeman-Day. And she's gonna talk to us about the planning and management data set that we have within the green city mapper. But real quick before I turn it over Stephanie, I just wanna remind folks too if you've got questions, go ahead and feel free to type those into the chat.

And then we'll have a collection for a Q&A after everybody's done, or you can hold on to them, and I'll call on folks later. Go ahead, Stephanie.
>> Thanks for the introduction, Sarah. I'm Stephanie Freeman-Day. I'm a PhD student in environmental science O'Neill SPEA, and my main research focuses on urban ecology and urban forests.

So I'll go straight into introducing this data layer. First of all, as many of us are aware, municipalities are increasingly using urban forests as a strategy and climate change for both adaptation and mitigation. For a lot of good reasons you can see there multiple studies that I've cited on the left hand side.

Urban forests have been connected with cooling of urban heat island but Dana was just talking about stormwater capture provision of shade carbon sequestration. And all of these are ways that urban forest as a then used in the management of climate change impacts. But here's the catch. Urban forests are also sensitive to climate change and impacted by climate change.

So, we know that climate change impacts the health of urban forests in Indiana. Their increased temperatures, more intense storms and spread of invasive pests. And so we asked this question I'm how urban foresters, urban forest managers preparing for climate change because we would need to be in technology, urban green infrastructure like urban forests costs and maintenance.

And some of these resilient strategies that are suggested for research include increased age diversity. Finding species that will do well in current conditions as well as future conditions and planting areas with lower canopy. The image that I have on the right hand side of the slide is just one way that climate change can and does and will impact urban forests now and into the future.

You can see them the plant keeps stress, defined as days with high temperatures above 86 increasing our historical averages. And now and in the the future. So that is just one part of my maintenance that needs to be considered in urban forests. And as far as climate change impacts go.

So a little bit of the background and the data collection for this layer M is a little unique and that the data collection began with a separate research project that was started by Bernie Fisher with best student Donovan Moxley in 2017. Looking for accurate urban forestry programs that were preparing for climate change.

I read shortly afterwards and we did with this project and define planning for climate change. The presence of its opponents working with another guys who tried to vote who created a map you can see on the right this assembly for active Indiana municipal urban forestry programmes that met the definition that we came up with.

And then we further adapted this index with Sarah Mincey and Sam Hamlin at UGI. And the terms of urban forest resilience. And that's where we came to the point where the layer is the way you can see it. Now, on this slide, the image on the right is actually a screenshot of urban forestry municipal climate change planning layer.

I'll go through the pieces of the index with you. There are eight components and I'll say they're not weighted. Your H1 is either municipality has done it or doesn't have that quite yet. So tree city USA member for 2018 funding from community urban forestry or IDNR the past 10 years, even for the past 10 years.

Arborist or urban forester on staff municipal tree ordinance in place. A tree inventory report and analysis, done by professionals the past 10 years, and dedicated urban forestry program within the city and also at the supergroup, such as a nonprofit that's connected with municipalities either planting or tending trees or educating people about the benefits of trees.

And so you can see, well first of all, I'll talk about these components and why they're important and how they're connected. Resilience is built with funding and dedicated resources, knowledge and expertise about the urban forest data to inform decision making, and also connectivity within the community. So you can see the screenshot shows the 74 municipalities that are part of our index.

And then and the number of components that they have with that we've seen evidence that they have. So the number and then the size of the doc could show you these communities. It is a little background and some spectacular statistics descriptive stats. So as I said 74 municipalities meet the definition of having an active urban forestry program out of 829 incorporated places in Indiana.

So we're looking at the 9%, who are doing the most planning, sustainability and resilience for climate change. And as you can see, most of our programs have up to three of those components with less than a percent in four to six or seven to eight. So again, we're really looking at the leaders and planning resilience urban forest.

So with that just looking at into the future both with this data layer and broadly into urban forests, climate change planning. Any layer updates, we probably will see new municipalities either we've discovered that are taking steps in planning for resilience of the urban forest or, went with growing urban forestry programs that start planning for this.

Sustainability in this way, an updated index could include specific climate change planning and inclusion of the urban forest and sustainability are climate change plans Citywide or Urban Forest. That explicitly incorporate changing climate with management of the urban forest. Finally we just see the Green City Mapper is the tool that can foster social connectivity between cities where people can share strategies.

People can share plans and do some regional climate change planning that incorporates the urban forest and also considers the urban forest its needs in general. To increase urban forest resilience but also brought the general community resilience. And thank you. And that's what I have.
>> Thank you, Stephanie.

That was great. Yeah, I was just thinking about your last point about Regional Climate Action Plans and how they're becoming more popular. And you can clearly see on the map there are regions where there are cities that are doing so much in terms of urban forest planning that could really contribute to those Regional Climate Action Plans.

So I think this is a useful tool, so for that reason and others. Next we're gonna turn to Sam Hamlin who is a postdoc with the UDI group. And Sam is gonna show us some interesting application of the Green City Mapper, which really speaks to one of the real focuses of ERI in terms of environmental justice and equity.

Go ahead Sam.
>> Thank you, Sarah. So yes, I am an environmental geographer with our project and so my interests are all things green infrastructure and all things water, but this time I'm looking at trees. And, so Stephanie has given you a really good idea of why we would be looking at trees.

And one of the questions we had with these robust data sets is thinking of resilience. What about social equity? And when we started looking at the literature, a lot of times equity is evaluated in terms of canopy cover, which is the quantity of the trees. And we started looking at the thinking about the quality of the urban forest.

And when we started looking there were some meta analyses. And there was we were seeing that there was a fair amount of inequity in urban forests in terms of both race and income. We also see significant inequity with tree canopy coverage on public land. But there hasn't been a lot of research done on tree quality.

So that's the piece that we thought we actually have these tree inventories. We have this really rich data set, we can start to look at this. So this is the background to what we were doing and We have been developing, this is some pilot research, which I'll return to at the end why it's pilot.

But as we were working on this research, we've also been working on the mapper and we were thinking, first question, canopy cover's been used so much and it's quite a bit easier as far as analysis. Can it still be used and still get an accurate assessment of equity?

And the other thing we were thinking about is the data on the mapper, this is public data. And these data can be used by planners to do a deeper dive into planning questions they have for their own community. And so we wanted to do this pilot work and see what that might look like.

And what we decided, is urban forest quality equitably distributed in the city of Indianapolis, okay? You can see two schools there that were not so much. But, so we calculated the Shannon Diversity Index at the census block group level in Indy. And so this is looking at species richness and species evenness.

So these were straight out of our street tree inventories. And then to look at some of those social data, we looked at population density, we looked at poverty. We were looking at different racial compositions and particularly percent Hispanic in a census block group or the percent black population.

Educational attainment, and then the building age, which give an idea of the age of the development. We also wanted to control for the plantable area, which to do that, we calculated the street length per census block group. And I don't wanna go too deep into the weeds here, but we did a spatial regression.

And here is the final output of what was significant. So we see an R squared of 0.27, and it's these bottom three that we are most interested in, the education, poverty, and the percent of Latino population. And specifically, we see that poor communities have less tree diversity in their street trees.

And marginalized communities, particularly Latinos, also have a lower species diversity. I also wanna point out that areas where people have a higher education, they have more street tree diversity. So, unfortunately we are seeing that, yes, there is inequity in urban forest quality in Indianapolis. So the question is, so what are the implications of this?

Well, having a species diversity and species richness, biodiversity, it's a crucial underpinning to ecosystem services, and to having more ecosystem services. So if we're seeing this lower diversity, it means these marginalized communities, they're not receiving the full range of ecosystem services. And it means in the future, they're more vulnerable to environmental change.

And an example of this would be the infamous emerald ash borer. We've seen ash trees get just decimated throughout the Midwest, if that happens in a neighborhood, then all of a sudden we're looking at tree loss, tree canopy loss, less shading. More heat vulnerability, more storm water runoff, all of those things that Stephanie was talking about earlier.

So those are the implications of this, or one implication of this. And for our next steps, as I mentioned, this is pilot research because we have a lot of street tree inventories across Indiana. So once we have really nailed down the method using Indianapolis, we'll be expanding this to about 20 other cities in Indiana.

We'll be exploring other variables, especially other tree quality variables, like the age structure and tree condition variables. And also in Indy and a few other cities around the state, we'll be controlling for areas that were previously redlined. And with that, thank you.
>> Thank you, Sam, that was an excellent presentation.

I see a few urban foresters who are on the line here, and I know that they have dealt with communities that have practically mono-cultures of street trees, often because that's what developers put in. And so they are well aware of what happens when you have a pest or pathogen that is species specific and it comes through and destroys the community's canopy, and obviously loss of ecosystem services.

How much more devastating to a community that's already a vulnerable community or a marginalized community. So this is a really good application of the tool, I think, for people to be able to identify these issues and work proactively to diversify. So I have one question in the chat, and I'll go ahead and address that one.

And then if others have questions, we can open it up, or again feel free to type those into the chat. So, Jerome Delbridge asks, he says tools to identify areas of cities most in need of tree canopy, that those are important. But also identifying plantable spaces is another critical element.

Are mapping tools available in the data set to show feasible planting spaces? And so, Sam, I think you address this a bit. Can you take that?
>> Yes.
>> So we are looking at this piece of it. What would be plantable space? And the way that we are working on this, the data are not on the mapper yet, but they will be shortly, is calculating the right of way areas.

So all of those areas that are outside of the vacant parcels as public land that are potentially plantable space. And we're also looking at how much canopy is already in those right of way plantable areas. And so that data will be available, like I said, fairly soon. Great and I'll just add a caveat to that, that of course we don't have details like utilities, yet included in the Mapper.

But that would be something that would also help us narrow down what is actually plantable. Kim Sook asked, how can you draw connections between what we currently understand about urban forest and other types of biodiversity like mammals, bugs, and migratory birds? I wonder if maybe, Heather Reynolds is another one of our teammates who's on the line and really, this speaks to her expertise, Heather would you take that?


>> Sure, that's a great question, I mean, there is existing literature for sure, I think especially of Doug Tallamy Research Lab, in New Jersey. Look him up, he's doing fantastic work and there's a lot of publications that show just how many different species of caterpillars, turn into butterflies in particular.

And that goes right up the food chain of birds, depend on our native tree species and the diversity of native tree species. So, yeah, the literature is there, I think it would be great too, if cities were able to add, also their own empirical work to add to the work that people like Doug Tallamy have already done.

So, yeah, I guess I just agree that the connection is there, the literature exists, to support that connection. And it's so important because we do need biodiversity at all levels, it all works together to create a holistic close to loop, ecosystem that provides the whole range of ecosystem services.


>> That makes me think about the EcoBlitz, data sets that might be out there for urban wooded areas that we might be able to get our hands on and add in. So that just speaks to our interest in ending this with asking you, if you know about data sets that you think would be good for us to be adding into the Green City Mapper.

Please get in touch with our team, we'd really, really, appreciate it, and we hope that you've seen some usefulness out of the tool that we've been working on for the last few years. Okay, with that I think I'll wrap it up and turn it over to Justin.
>> Thank you, UGI team, that's some great updates from your work and research, really neat stuff.

I'd like to at this point, turn it over to one of the ERI fellows, at least for a little bit, Matt Houser has been working with the Hoosier Life Survey. And he's going to update us now on some of the second round of the Hoosier Life Survey. And some of the I guess, initial results so with that, I'll turn it over to Matt, the floor is yours, thanks.


>> Thank you so much Justin, thank you Sara, wonderful work so far, give me a second here. Okay, thank you for your patience as I navigate Zoom, yeah, so I wanna just share, this is very preliminary, I want to put a caveat on that. I'll emphasize that six times on this, but this work is led by myself and Dr. Erickson Weiss, but there's a large number of people on this team including Heather Reynolds.

Justin and Kimberly have been a key part of sorta our outreach program from this, and they've done wonderful work with the original Hoosier Life Survey. I will acknowledge everyone at the end, but I wanna note that this is a big team collaborative effort and it's been super fun.

So, I think I'll begin just by stating the obvious, it's really been a hell of a year, if you look back, we had a global shutdown because of Coronavirus, people were dancing in the city streets of New York. As a consequence of the shutdown is that global recession, huge economic impacts, particularly for people in the restaurant industry.

We had a reawakening to issues of racial inequities, and inequalities, and the need for police reform, there was also a toilet paper shortage, I forgot about that. But I was presenting this, we had all this weird stuff happen, in other words, we lived through sort of multiple society shaking events in a short period of time over the last year.

And I'm a social scientist student, I can't help but wonder how individuals responded to this sort of structural shifts, these structural challenges, how have we changed? And specifically, I'm an environmental sociologist and with the Hoosier Life Survey I got curious. How did the public's climate change of views and resilience behaviors change in Indiana, as a result of all of the events going on in 2020?

There's not a straightforward potential here, there's not gonna be a one to one, one potential shift, is that we see a decreased level of climate change concern and related behavior. There's not a ton of research on how these sort of structural societal changes impact individuals environmental views, but what has been done, focused on the 2017 Great Recession.

And that work suggests that as a consequence of the recession, we saw a national level dropping concern about climate change, there's a couple of reasons for this, I won't talk about it too much. But one example is finite pool of worry, the basic premise here is that you can only have so much anxiety or concern in your life, many of us are probably at that point right now.

And the idea is once these big, if an economic thing happens, if a global pandemic happens, that sort of fills up your worry buckets. And you're not as concerned about long term consequences like climate change. But I wanna note it's also possible that Hoosiers are actually more concerned about climate change than ever.

An awareness of the likelihood that catastrophic threats, which are widely predicted by the scientific community, will eventually materialize. It's probably likely never been more widespread than right now, stay at home orders may have enabled more people to pursue resilience activities while they waited out the crisis at home.

And there's some preliminary evidence from Yale, for instance, that suggests that since the emergence of COVID the American public has become more concerned about climate change. So, in other words, we just don't know what's going on here, pro climate change views and behaviors could have increased or decreased.

And we wanted to investigate to understand how these structural shifts like COVID, like the recession, like Black Lives Matter, had impacted individuals concerns about the environment. And we've really had this kind of amazing opportunity that just fell in our lap, and you know you're speaking about sociologists whenever they're, this pandemic was an amazing opportunity.

Only a sociologist can say that but, we got to take advantage of a natural experiment, what we have is just and said the Hoosier life survey, the original way. We'd sent that out between August 29, and we stopped accepting new responses right at the beginning of March 2020.

In other words, it's sort of our pre-pandemic measure, we got people's views before COVID had been widespread in the United States. And in total we had about 2,700 respondents to this first wave of the survey, and we follow that up to understand change in attitudes what we're originally very, very creative bunch.

But we called the Hoosier Life Survey 2.0, and that ran from October 2020 to march 2021. And I want to note again that these ultimately, what I'm gonna be presenting are preliminary results. So, we sent out a web survey and we sent out a survey through the mail.

Because of COVID, because of all that stuff, it's taking a while to process the paper version of the survey. So, what I have to present right now is the web survey results only. And so that's gonna compare about 570 respondents. And specifically, I'll look at just those people from their 2019 responses.

And compare them to what they said to those questions in 2020. And I want to know, this is probably biased in some way. These people are probably different in some way than the people who filled out the mail survey. In all likelihood, they're younger and wealthier and more urban.

Those are the people who tend to have access to high speed internet and the computer in the state. So, you can pull a grain from the salt, take everything we're about to say with a grain of salt. So, I'm gonna first talk about how the Hoosiers actually experienced 2020, what did we see here?

Well, we asked them, which of the following do you feel like is the most important problem facing the state of Indiana right now? And unsurprisingly, the vast majority said COVID-19, 64% of our respondents. We also saw the second, a distant second. But, a telling distant second I thought, government overreach was the second most pressing problem facing Indiana at this time amongst our sample.

So, given the how widespread concern about COVID was here, we also asked how has the COVID-19 pandemic affected you personally? And we saw a range of responses, the vast majority of people saying I'm spending less time with friends and family. I have someone close to me who has contracted COVID.

And I think this one's particularly important note towards the impact of the recession. 42% of this sample said, I or another member of my household had work hours cut or I lost a job. In other words, these people weren't just impacted by the pandemic side, lots of people were also impacted by the economic impacts of COVID as well.

We also asked questions about the Black Lives Matter Movement, police reform, perceptions of racial inequities. And we asked people to report about how their views of these issues had changed compared to what they were six months ago. So, this isn't panel data, this is people reflecting back on their own views, taken with another grain of salt.

And I want to say, you look at this graph and it really doesn't suggest much is going on. And I could actually say, you should ignore this. Because if we look at this all aggregated, we're missing sort of a key piece of the puzzle in terms of people's views on these issues.

So, I'm gonna switch this graph is the same one broken up by Republicans in the red line. And Democrats in the blue line. And we're focusing on their perceptions of the Black Lives Matter Movement. And if they have become much less supportive here or much more supportive here.

Now as you can see, Republicans have this sort of very clear trajectory. They're much more likely to become much less supportive of Black Lives Matter reportedly, over the past six months. And Democrats are the entirely opposite, much more likely to say, they've become much more supportive on Black Lives Matter Movement over the past six months.

So we not only see a reported change in attitudes about racial inequity and police reform. We see growing divisions and tensions across the state of Indiana as sort of the views of these issues widened across the two political parties. Overall, 70% of our respondents said life was worse or much worse in 2020 than in 2019.

It is a tough year, it was hard, it's no surprise. But as you're all probably wondering, what about climate change? You've talked about the year and how do people view things. So, one of the results to me that wasn't that surprising, but still is noticeable is that Hoosiers reported hearing about climate change less frequently in the media.

So, blue in all of these slides is gonna be the 2019 response and gray is gonna be the 2020 response. So we can see that in 2019, 36% of our respondents said they heard about climate change daily in the media. And we see a 14% drop in that for the 2020 results.

So a pretty significant change. And again, this is probably because we're hearing about all those other issues. Those are sort of taking up the finite media space and people aren't as exposed to climate change information. We also asked them about, what their household practices were under this sort of premise that they'd be at home more.

Or they'd be more willing to take on resilience practices that we had asked about in 2019. And we actually found some really rather limited increases in household resilience. I'll say personally, this was the most surprising result to me as really optimistic. I was kind of shouting it from the rooftops that we are gonna see this change and I'm a bit shocked.

But the biggest change was in the percentage of people growing food. So, we saw about a 5% increase amongst this group of people reporting that they were growing food in their own backyard. But everything else like replacing lawns with prairie grass was a pretty small jump, composting food waste, we actually saw a slight decline.

And a really interesting one is that about 10% of people that we saw drop in the number of shading trees around people's homes. This controls for the fact that people could have moved. So what this says is that about 10% of people cut down shade trees around their house in 2020.

Rolling over around climate changes there were some good signs as well. So, Hoosiers were actually more likely to believe that climate change was happening in 2020 as compared to 2019. We see a 6% increase here from 81% saying climate change is happening of this group in 2019 to 87% in 2020.

And this result to me again, sort of hides the more compelling interesting component of it. Which is who changed, who actually is responsible for this 6% increase? And again, it's a bit surprising. We see here the democrats in 2019 and 2020 are 99% believe climate change is happening.

They basically can't go up. The shift was amongst Republicans. From 2019, we saw 61% of Republicans believe climate change is happening. And we see a 15% increase in 2020. The 76% of Republicans now believe in this sample climate change is happening. So this is a really surprising, it's a huge jump.

I think we can speculate lots of different reasons why that's happening. But to be honest, I'm not totally sure, it's really interesting and certainly surprising. But ultimately the results are that there's a variety of things going on here and this one's maybe the most shocking of them all.

Okay, so I'm running out of time to wrap it up, it's clear 2020 was a tough year on Hoosiers no doubt, right. Hoosiers adoption of climate resilience practices of home appears to be limited at least at this stage. But maybe we'll get something different with the mail survey wave.

But attitudes at least amongst this sample about climate change could have shifted in unexpected ways. We're beginning to see some evidence of points towards that. But again, ultimately this is preliminary and we need more research on this topic. So I just wanna acknowledge the whole team IU Grand Challenge for funding it, the IU center for survey research for helping out with a lot of the work.

Thank you all for listening, and I'm happy to take questions.
>> Thank you, Matt. I did see a couple comments come up in the chat. I don't know if there's any specific questions. Rachel mentioned that was thinking along similar lines as Heather, it would be interesting to look into garden management intention leads to trade offs in the provisioning a different ecosystem services, I don't see any questions.

If we don't have any questions for Matt, anybody?
>> I'll state my question, Is that okay?
>> Go ahead.
>> Okay, yeah, no, I did, I was sort of musing but it is kind of a question Matt, whether if the decrease in shade trees really represents, I think you argue that it represents that cutting of shade trees.

It is possible that people cut them in order to make room for gardens or solar panels and it might be possible to assess that out from your food guarded energy. I can't remember if there was a question about solar panels.
>> There was, I didn't put it on here, we saw a pretty small increase.

It was like 0.5% increase in the percentage of houses with solar panels. If I remember correctly, there was a pretty big jump in terms of the percentage of people who want solar panels, that was sort of the thing that bumped up. So we can tease out if there's some sort of relationship between the likelihood that you lost or you no longer have a shade tree, and then another practice, we can do that through inferential analysis and that's actually a wonderful idea.

We certainly should. And part of me just wants to go and interview some of these people and see if that's really what they're doing or it's just such a surprising result to me that I'm a little hesitant to jump in it wholeheartedly. I kind of want to follow up and understand as you suggest other, a bit more of what people were thinking or why they answered in this way.


>> Great, Jerome added a comment that his experience with shade tree management this year is that neglected maintenance or removals of tree were addressed after being at home and harvesting, more money to spend on tree work etc. So that's another potential reason, great initial analysis. Matt, thank you so much for presenting today.

Rachel, whenever you're ready, yeah, go right ahead. So, All right, looks like we're all set. Rachel, the floor is all yours, thanks.
>> And Rachel, if you are-
>> Sorry-
>> There we go.
>> I'm trying to start zoom, my apologies.
>> No worries, thank you. I'm sorry, I'm trying to get this to be full screen.

Okay, here we go. So I'm Rachel. I'm a research technician working with Matt Houser here at the ERI. And we are working on a project interviewing farmers, and today I'll be telling you some of the preliminary research that we have dealt so far. Uh-oh, here we go. So the research is part of a National Science Foundation funded project, looking at the dynamics of integrated socio-environmental systems and the research is contextualized in a interdisciplinary perspective.

So it's drawing from both the social sciences and the natural sciences. And in the context of climate change here in the Midwest, drought is predicted to increase or rather changes in precipitation regimes are expected in the future. So this will directly be affecting farmers and how farmers manage the production of crops.

And at the link between the social and natural sciences, one of the focal areas for this research is on soil health. Which in the context of the social sciences perspective, we're looking at soil health in terms of, how farmers are nourishing the soil for long term fertility, especially in ways that minimize the use of chemical inputs.

And so over the course of the project, drawing from ecologists and historians and also the social sciences perspective. We're trying to understand how and to what extent adaptation can reduce farmers vulnerability, and agricultural systems vulnerability to current and future climatic conditions. So I'll be sharing some of the social sciences perspective thus far, starting with farmer interviews.

This is the first year of the four-year project, and we're conducting serial interviews with farmers across the region, the Indiana, Illinois, and Michigan area are the sample area for the study. So we just finished completing 90 interviews with farmers running from January to just a few weeks ago.

And this constitutes the pre-planting season. And the farmers that we reached out to are a representative sample of row crop farmers. These farmers come from the Farmer Panel Survey which is run out of Michigan State University. And the main criteria for selecting farmers in this first round was that they were either irrigators or non-irrigators.

And so we'll have two more rounds of interviews over the course of the year, mid season, later this summer. We'll be following up with farmers who either had conventional or more progressive, so they'll help management practices based off of what they reported in the first conversations. And then at the end of the year post harvest, we'll talk with an even smaller subset of the farmers to hear their reflections on management.

This is, so here's just a quick image of where the farmers come from, who we've spoken with. As you can see, it's across the tri-state area and the breakdown for the 90 farmers that we spoke with. 30 of them were irrigators and 60 were non-irrigators spaced evenly across the three states.

And this reflects the general ratio of the farmers are irrigating or not irrigating across the Midwest. And to talk with farmers, we used this in my structured and guide. Although interviews thus far were conducted over the phone just because of COVID, that made things easiest. And in the conversations, we covered five main areas looking at the pain of a farm overview, hearing from farmers about farm size, the crops they use, the fertilizer management programs, how they till, the decisions that go into how they run their farm.

And then specifically talking to them about soil health, trying to understand if they are familiar with soil health, how they manage personal health, why they value or don't value certain things related to soil health, water management, looking at irrigation but then also drainage is a big issue for farmers.

And the last part of the interviews, we focused on topics related to the future of agriculture, both on their specific farm plots, and then also their perspectives on the future of agriculture across the Midwest. And likewise with climatic conditions, asking them questions about their personal experiences, what are the main weather events that they deal with day in and day out.

And then also what they think about climate change as a whole, and how they feel agriculture will fare in the future. How they will cope if they're concerned about that or not. So its gonna be really interesting getting to talk with all these farmers from across the states.

And preliminary findings thus far, we're currently coding everything in vivo and quantifying the results. But preliminary findings thus far are that most farmers that we spoke with value soil health, the majority are familiar with the concept, and nearly all believe that it is important. Citing various reasons but the key things that kept coming out are the economic benefits of soil health, the environmental conservation value of soil health, some farmers citing both.

And what was interesting too is that most farmers who are familiar with soil health indicated that they are actively promoting soil health either through one management practice or even multiple management practices stacked on top of each other. And again, many farmers familiar with soil health indicated that they want to learn more or do even more to promote soil health on their farms.

There does seem to be some bias in soil health management practices, which was really interesting as well. The majority of farmers indicated that they thought that their chosen management practices promote soil health regardless of what that management practice actually was. So when farmers are talking about tillage or drainage, cover crop usage or non usage, how they manage for fertility on their fields, almost everyone thought that they were promoting soil health.

So for example, taking tillage. Farmers could be doing more conventional deep tillage practices where they're going in and turning the soil over all the way to the other end of the spectrum of no-till, where they're planting more or less directly into the surface itself. And both of these practices have really different consequences for the soil structure, the amount of carbon that's either stored or at least in the atmosphere, effect on the bacterial and microbiology in the soil.

And on both ends of the spectrum farmers really believe that their practice was promoting soil health. So this was just fascinating to kind of pick up on conversation with farmers and also to hear other farmers reflecting on this very thing. So I pulled out here three quotes for you of farmers reflecting on how they really think that everyone thinks they're doing the right thing.

So one farmer says that, different guys have different values on soil health, or everybody seems to know that you need healthy soil to try to get the best yield and make the most income. But there's a lot of different opinions on how to go about it. And I really love this farmer who shared that, he felt that probably in everyone's heart, they believe they're a steward of the soil and that they all think they're doing a good job.

So this was all just really interesting to hear from them. And then looking at the the information that's been emerging around weather and management practices related to the weather, really the almost unanimous concern is that there's too much or too little water at the wrong time. Farmers were often telling me that, they complain all the time about the weather which they just want perfect weather and it's never perfect.

But the perception of irrigation if farmers saw it as a valuable thing for the present or future adoption, a lot of the perception around irrigation seems to be tied with their personal experience, with the local moisture conditions at their farms. And then also seems to be affected by the length of the farm, if it's flat versus rolling hills, the actual soils, if they are well drained soils or if they are more moisture holding.

These types of things really affect the farmers perception of management when it comes to irrigation. And then also the economic return on investment. It's expensive to install and maintain irrigation systems, but the payoff for higher yields is also there. So farmers wear many hats in addition to just growing crops, they are business managers, and so this was a common thing that came out of the conversations with farmers that spark.

And in terms of climate change and farming, these were really interesting parts of the conversations. And it seems like many farmers do believe that climate change may be happening, but they're doubtful of humans role in climate change. And so there were also mixed perspectives when I asked them questions about, if they think that climate change might be leading to more extreme weather in future, some certainly said yes, others said no.

But in general most believe that regardless of what weather comes their way that their farms will be able to cope with the changes. It is also interesting that some farmers really do have concerns about climate change and that they are actively doing things on their farms now to try to build resiliency in the face of changing weather conditions.

And so one farmer in particular I'll share a quote with you from, but he was indicative of other farmers who are seeing soil health as a means for building farm resiliency. So he really captured that concept here, he told me that, tying back into soil health. His way of augmenting not investing in irrigation, is that, if I can have better soil health that will help not only absorb the water but keep it so the plants can continue to utilize it.

If we don't have a lot of organic matter, particularly in the soil, the water just goes right down. So we may have a good rain but after three or four days the water is done. So what do you do now? So that's why I'm thinking soil health is the way to go.

So it's really interesting to hear his thought process on this, especially because it does tie into really all of the concepts that we were hitting on in the interviews. Tying into soil health, and management practices, and irrigation, and climate change. So it's really exciting to have all of these conversations with farmers and see what's emerging from the dialogue with them.

And so as we're recording this and quantifying the responses, we're also simultaneously preparing for the next round of interviews which are coming up sooner rather than later. And so the directions for future inquiry, things that have kind of emerged from these initial round of interviews, we would like to learn more about farmers management intentions, and how those either materialize or don't materialize into action later in the season.

Basically is what they say they want to do, what they actually do. And asking them what went into why they were able to achieve what they wanted to, or what deterred them from implementing their plans. And then hoping that we can take this information and make it useful for other farmers who are probably facing or possibly facing similar challenges on their own firms.

And we're also curious to learn about why farmers who are pursuing soil health, why they're doing so even if there is a lag time in the direct benefits that they're seeing, because oftentimes the benefits of soil health maybe years out. And so it's really interesting to hear from some of these farmers who are very focused on the short term profitability of the farm as the primary aim.

Versus farmers who are obviously concerned about profitability but have more of a tendency to focus on the soil health and the potential benefits down the road. So we'll be looking into this later this summer as interviews progress. Thanks so much for letting me share this initial preliminary findings, and if you have any further questions, am happy to fill those now.

You can reach out to matter myself via email, and I just like to also acknowledge that this is part of a collaborative effort. So many thanks for helping get the interviews completed. And this is the first of a four year project. So the soil testing that ecologists are going to be conducting this down the road and will all tie in to the project Thank you.


>> Thank you so much Rachel. You did have a couple of questions post in the chatbox.
>> Okay.
>> I'll be happy to read them.
>> Sure.
>> So Nathaniel
>> States, the insights into other farmers motives is really interesting. Some work suggests that in some cases, people tend to perceive that others are motivated by self interest more than they actually are.

Looks like that misperception may not be the case here though. Well, again saw preliminary information so much who it's coming from. I'm just looking at all the different responses from farmers, and you haven't quantified it yet to be able to really answer that. But it does seem like there's just mixed perspectives on that.

Some farmers are really focused on what makes them profitable here. And now others have kind of a general a bigger picture or more holistic picture perhaps as to what goes into farming.
>> Perfect thank you. And Heather had Posts, Heather Reynolds had posed the question in the chat box also.

Heather, would you mind posing that?
>> Sure, yeah, I was just curious. I may have missed it, I know you've got the irrigated versus non irrigated farms. That was the primary split, but presumably you also have a breakdown of farms in terms of whether they're organic or conventional


>> Also their farm size and their crop focus, whether they're specialty or commodity. Coz it seems like all of these things and also in light of mass ,who's your life survey political affiliation. Seems like these could all be important covariates in terms of how they choose, how they feel about climate change and whether or not they're supporting soil health and why.

So, just curious if you plan to do those types of analyses.
>> Definitely and that probably can speak best to what the actual analysis will look like. But we definitely do pick up on that in the conversations as if they're forming in an organic or more conventional sense.

And because of the nature of interview research, any conversation is able to follow the line of what emerges from a specific farmers experience. So, there's a lot of really rich data that comes out of conversations with those rather unique farmers who have specialized in organic crops. And I say unique in the terms of row crop farmers, because in row crop world, we're talking about a hundreds if not thousands of acres.

And it's typically conventional ,typically just corn and soy. So, when I do have a conversation with a farmer who happened to be farming organically or farming for niche market, it's kind of exciting because they are just an anomaly almost. And so, those conversations do, I do try to learn more about what goes into the decision making.

How they even got into that in the first place.
>> Rachel, Matt could either of you kinda of touch on the timeline for the project? I think you mentioned a second round coming up, but four years project work. So can you, maybe just talk about the timeline a little bit when the project will finish up and in deliverables will be available?


>> Did you know you're probably on the spot here, well end deliverable civil thought and make things available as we go along. And as we have each, I would view it as a series of data sets for collecting. So, this sort of year one data set, as we get that process and published per NSF guidelines, would put it up online and will be available.

Everything will be, let me say it this way, you wont be able to know who said what. But the quotes and information like that will be accessible. The ecologist also have a plan. Not totally sure when their work will be done in terms of shareable, but by year four, so I think at that point this is that's 2024 right now.

We'll be delivering that information back the farmers so their analysis should be done at that point. We'll have data for them. And then our end of project will be, if I'm remembering correctly, December 2025. Will be ultimately done and shortly after that, should have sort of our final two years of interview data available and done.


>> Thank you. Any additional questions for Matt or Rachel before we kinda switch gears into the next set of presentations. Perfect, we are one minute ahead of schedule. So, with that, I am going to turn it over to Kimberly Cook. Kimberly has been with us as a data management assistant since March of 2020.

And she has been very helpful and documentation specifically and interviews with researchers. Many of you may have had an interview with her. She will be leaving us this summer to join a PHD program in the University of Kentucky. And I just wanted to take a moment to thank you Kimberly for all your work with me and for me.

So with that, Kimberly is going to talk about some of the, I guess, data descriptions or draft of some data descriptions. As you all aware today we looked at several different types of data and to kind of standardize or make datasets more descriptive. And I guess in a process that would standardize almost all of our data sets, she has began to put together an initiative to kinda of put together some standards.

So with that, I'm gonna turn it over to Kimberly and let her present on that. Go ahead.
>> Yes. Yes, I will share my little screen here, to do presenting mode. All right, can everybody see my screen, hear me? All the things will be down here. All right, so like Justin said, my name is Kimberly.

I'm the data management assistant for the ERI. So I've been working with Justin for the past year on a variety of data projects. And as the ERI is moving into this sort of next phase with our new leadership, and as all our research associates and researchers gather their data.

We're starting to think about how we can better integrate those data and as well as work across both ERI researchers, and get the word out about ERI data for external partners. So, lately we've been working on putting together another caveat that seems to be the theme of today.

Preliminary data description standards, subject to change, but this is sort of the basic. So to start with, we have these sort of two different categories. We have the basic description guidelines. So these are just basic expectations for all of your data sets. And then on the resilience you'll see a list of best practice sort of brings in the basic, and then adds a little something extra the lip cream on top.

So starting on the left side, so the basic description guidelines. Start with having a descriptive file name. So something that tells us something about your data set that, that just tells us something that can be the project name. That can be who recollected when it was collected, something that matters about your data set that you.

But you want people to know. Secondly, describe your units of measurement and how those units of measurement came about. So, even if you think it's obvious in your tabular data set, for example, you might want to go into more detail about your units and where they came from.

Also derive data products, it's really nice and lovely to reuse data that already existed out there. We love doing that, we love when that happens. But it's important to describe how you took that pre-existing data set, what you did to it, and how it fits into other data that you either collected or maybe collated from other resources.

In addition to that sort of crediting the original data generator in that project that might have created that data. And of course, there's some sort of nuances that go along with that, but basic requirements. And lastly, everybody loves metadata, right? Try to have a metadata standard. A lot of disciplines have working groups working on metadata standards for that discipline.

But if you feel like you can't find one that fits your data needs, you don't think that it's structured the right way or there's another issue with it, try to have a data dictionary where you might have come up with your own variables and your own variable descriptions.

But have a sort of separate document where you describe each variable where it came from. And actually, sometimes you might have a variable description in your head, and then you might have written it down or named it something different like an alias in your tabular data set, for example.

So try to have a data dictionary that draws those connections, that makes it easy for someone who was not involved in your research project to understand it and how it all fits together. So building on top of that basic layer, it's also important best practice to have your data types, match your data fields.

And this is a common issue with dates, for example. So to start with, you'll wanna make sure that all of your dates are structure the same way. And make sure that your date fields are in fact indicated as date fields rather than general text or decimal, something like that.

Pretty simple stuff, but just double-check it. You also wanna have a point of contact for your data sets, so this is ideally someone who is perpetually involved with the data. Perpetually in the same position to be able to access the data, and either answer questions about it and redistribute the data as well.

Ideally, also someone who has had contact with the data in its generation, so someone who's worked with it or gathered it, something like that. Thirdly, unique identifiers, things like DOIs. So IU libraries is capable of minting DOIs for your data sets, that's just one example. There are other ways to go about doing this.

And again, there are a lot of nuances associated with unique identifiers for data sets. Because if you have a ship, you replace all its parts, how this other ship is at the same ship, that kind of thing. And again, that's sort of a case by case basis, but it's good to have the notion of a unique identifier in your head because you can connect your data set to any publications that resulted from that data set.

And also as someone reuses your data, they can point to that specific DOI, and that sort of takes care of the problem of versioning, so which version of the dataset they use. And lastly, standard vocabularies from your discipline. So in information science, we call this ontologies. So you wanna make sure that for example, the term animal means the same thing for your users.

That's kind of a simple example, and making sure what the standard vocabulary is for your discipline. And this is kind of a more complex thing, more nuanced, and the data team would be happy to help you find things or help you figure this out. So all of these zooming back a little bit more, these description guidelines will be provided in a document with further descriptions about what each of those means, as well as links to external resources.

For example, for the metadata standards, it will have links to specific metadata standards that might be applicable to ERI research. And so building off of that document, we're working on trying to think about how to work better between the data team and research teams based on this sort of data description guideline.

And so this sort of draft workflow, the idea, the concept is that the data team will review ERI data sets for completeness based on the description guidelines I just described. And then the items that remain to be addressed will be communicated to the research team through a shared document, sort of a checklist type thing.

And then with support from the data team, the research team will be able to ensure that data descriptions are complete. And then finally, with better data description, ERI's data and research is more visible to an outside audience. Cuz that's what this is all about, we wanna communicate across ERI's researchers and with potential collaborators in the future.

So that's all I have now. Again, this is a work in progress, so you might hear from the data team about providing feedback to us about the workflow and the documentation. But stay tuned, this is coming in the future, and thank you.
>> Thank you, Kimberly, again for your work on that and the presentation.

Do we have any questions for Kimberly? Again, this is an early stage of a draft, it kind of standard operating procedures that we're trying to put together to, I guess, get a handle on all the different types of data being generated from all the various research groups within ERI.

All right, if there aren't any questions for Kimberly, I am going to share my screen, and I will present the final presentation for today. I do not have a PowerPoint presentation, instead I want to do a live demo, and I guess expose this audience to a few data resources and tools that we are making available through the ERI.

So I am at the ERI homepage, from ERI homepage, I wanna look at the Tools and Resources page. And I wanna just highlight some of the tools and resources that we make available on this page because we're going to be talking about the data resources page. So within that tools and resources, we've stored up a page that kind of displays, I guess the various data sets and data repositories that we kind of are incorporating into our ERI data platform.

So when we look at the ERI data platform, I'll show it here in a moment. But I want to highlight the data sets that are made available on that ERI data platform. So we've got several repositories for statewide data. The Indiana map, we're all aware of, I'm sure the Indiana map is a large repository for Indiana data.

Many of those data services are going to be migrated to state government. State government has similar to Indiana map, they have. Data Services are GIS services that we can kind of tap into and bring into our data platform. And then there's also at IU. We have a product called ArcGIS Online.

And the UGI Green City mapper, all of the content that is hosted on that, all of that content is hosted on this ArcGIS Online environment. And that is made available through IU, through a standard software license with ESRI. So, these Indiana open data sets I want to highlight those three different repositories.

There are all kinds of storing spatial data. And then we've also got down here some other types of data resources, including some future water. And as Matt and Rachel, were just talking about the who's your life survey. These are different data sources that you can, I guess go look at the actual pages and view them.

We're hoping to kind of bring these independent tools bring the data behind these independent tools all in one place through an ERI data platform. So while the Indiana Green City mapper is focused primarily on urban Data sets, urban green city data sets. We may have other researchers like the future water, data set producing their own standalone tools, but we kind of want to bring all of these data sets into one, I guess viewer or one data platform.

And then there are some additional data sets that we subscribe to. So one for instance that I wanna highlight today and I'll show you how to access this momentarily. Is that ERI has entered into a relationship with Planet Labs, and Planet Labs provides daily satellite imagery for the whole globe.

They also provide services similar to Indiana Map services isn't that there's, data stream you can just stream into your applications and access their imagery and tools that we develop. So with all these different data sets described here on data resources, I'm going to kind of walk through several of these different data sets and show you how you would access them.

I'll just go ahead and start refreshing the page. So what we're looking at here eridata.iu.edu this is your main default, what loads when you visit the page. The first data set that I wanna walk through is what I just mentioned, the planet's satellite imagery. So you get some instructions here to begin with.

You can read through those on your own. What I'm going to walk through now is the adding satellite imagery to a place so let's say I just want to zoom into a specific site. Many of you may come down from Indianapolis down to Bloomington and have to go through Martinsville right now.

And many of Martinsville, the highway is shut down right now because of I69 construction. So I want to demonstrate or visualize some of that environmental change taking place. I can I'm looking at right now base maps, every base map. So if I want to change my base map to an ESRI base map, I can do that imagery hybrid, change it to imagery.

So these are base maps that are provided by the vendor. The ESRI, this is common functionality that you'll find on many tools including Hana demonstrated earlier this functionality on that UGI Green City mapper. What I want to bring your attention to is not the base maps, but the subscription service that we have subscribed to with Planet Labs.

I can go all the way back to 2016 Look at what the imagery was in August of 2016. And this is pulling it in right from Planet Labs. So this is satellite imagery for 2016. And if I go now and look at 2021, just last month, as soon as I do this, you'll notice the large Construction project taking place right here in I69.

So we can actually see that visualization of the environmental change. Back in February before the construction season, some of these were not as large some of these right away cuts were not as large and we also have some snow on the ground. So this is not just for Indiana, I want to use Amazon, rainforest, Amazon Brazil.

There we go. Take me there. So if I want to monitor what the rain forest, actual deforestation in the Amazon, we can zoom into an area and see what it was in 2016 or 2021 or 2018. You get the idea. So, we do have a 3D globe right here so I can spin this globe well look at the whole globe.

But by adding this temporal data, we now actually have a 4D visualization of anywhere on the globe. So this is important knowing that many of our data sets are specific to Indiana. However, we do have several global data sets that are being generated. Climate modeling for instance, or even regional data sets that will cover several states.

So that need for a tool that is a global tool and not just specific to the Indiana geographic extents, is what we're fulfilling here. I'm just going to refresh the page. So I highlighted or demonstrated that type Planet Labs mat, monthly satellite imagery, know that that's there again, anywhere on the globe, not just within the Indiana that is available.

I want to switch gears now, and go over here and start highlighting some of the open data sets that are available in this tool. Looks like I've got 15 minutes. So I mentioned in our data resources and tools page, we have several repositories for Indiana open data. The Indiana map as long been the repository, a repository for geospatial data for Indiana, so all of the map services that are on Indiana map are available here.

And if you want to just start typing, you can identify by environment. Or as soon as you start typing all of those layers that match your query string are brought in here. So I type census and now I have several census layers. I can bring one in just by clicking it and then we'll see that it's actually drawing and this is requesting it from the Indiana map so it takes a little bit but there they are.

Again, I'm going to remove that now. And In.gov similarly, if you have imagery or another layer from the indiana.gov, you can add that layer here. That's a second repository that's not housed at IU. So you can see there I just brought in Aerial photography from 2011 to 2013.

And that was brought in from the in.gov state GIS server. I mentioned earlier. I'm going to refresh this real quick. I mentioned earlier the IU ArcGIS Online organization there is a lot of content being placed in that Organization right now. So an example would be if I want to may be go down here and look at the floodplain.

I can go to the IU ArcGIS Online. And I know that we have a layer in here called plane so as I start typing flood, it will populate and then I'll get a list of all of those layers that actually meet my criteria eventually. And we can see that the 100 year floodplain comes up to the top.

And this is a layer of being brought in right from ArcGIS Online, a cloud hosted environment. We have, all of the Floodplain, the 100 year floodplain right here. And if I wanna go in and see where that is on a 3D look and see, you can do that.

If I wanted to add a little wider data to that to really give it some, I guess elevation context. You can do so and then adjust the transparency once this is brought in so that you'll actually get a much better look at the digital elevation model that's available here.

And if I wanna kind of adjust that, I can see, maybe to adjust the transparency to show that actual creek bank or the digital elevation that I'm looking at here. And I can look at those elevation models as they relate to that flood plain area there. So three repositories of geospatial data for Indiana that we just covered.

And then this last one is IndianaMap content that is being migrated from the IndianaMap server to ArcGIS Online. So several of the Indiana map layers or many of the IndianaMap layers can be hosted on ArcGIS Online rather than through an ArcGIS server. And that's what we're looking at here.

So these are basically all of the IndianaMap services that have been migrated to IU's ArcGIS Online. And I can bring any of those in, and if I wanna look at the building footprints and maybe look at those building footprints that are in the floodplain, I can do so right here.

So I can see the floodplain and see these individual buildings that are inside there. And maybe do some analysis or something along those lines. Okay, so that is the Indiana open datasets. I've got about ten minutes left, I wanna cover two other types of datasets that we're making available.

I just refresh the page to refresh the map. I wanna now focus on some of the curated datasets. So we have, again, the Indiana open datasets, but there are several datasets that we wanna make available through a data platform that are not specific to Indiana or not an Indiana State Government.

Many of these like tree canopy, national flag hazards, several of these are, what, national datasets, or US specific datasets. But there are also, what, global datasets like this artificial sky brightness. Again, that's a global data set, trying to view something like this on a smaller extent and an IndianaMap viewer or Auburn Green City map viewer may be a little more difficult.

So these global datasets having a global viewer to allow for that will, I guess, allow you to view or interact with datasets that are not just local to Indiana. Each one of these datasets are kind of described here. So as I go down here into, excuse me, the data platform, we have the ERI curated datasets.

So what we're looking at there, we have descriptions of what these are. As I go to the viewer, we only have a small description and a link out to the individual datasets. But if you wanna go back to our ERI resources and tools, every one of those curated data resources has a small description here and why we think they should be included on that data platform viewer.

So with that in mind, if you think you would have a, or you can identify a specific dataset that would be of use or that you think should be included on an ERI data platform like that. Please send that dataset or a link to the dataset our way and we can see if we can incorporate that dataset into a viewer or make it somehow accessible in some of our online tools.

All right, I'm going to not spend much more time on the curated datasets, but what I did want to demonstrate on the ERI curated datasets. Now that many of these, do I not have that in there? I thought I did. Now that many of these UGI datasets are being made available, I envision those kind of showing up here either on their own folder or in a ERI curated datasets, so we can bring those in to, I thought I had it on here but I didn't.

Several of those layers that are on that Auburn Green City mapper can also be included in here just as checkboxes like many of these other layers, we got a tree canopy layer. So I envision several of those layers that are available on other tools to kind of show up in here as either checkboxes or their own individual folder like that.

Another one that may be of interest to some of the biology folks. You choose a species and then you say show the habitat for that, and it will eventually bring that habitat for that species in and it turns out there, that is not really present here, but it is present in the southwest there.

So you can look at the legend and see that, yes, during the winter, the habitat for that species is right there. Okay, so I only have maybe five or six minutes to allow room for questions. So I want to move along to bring your own data. I'm gonna just refresh the view again, and bring your own data can be anything from, there are several different types of data and several more in development that will be included in this.

But one of the biggest ones right now is the ArcGIS Online feature service. I mentioned several other research groups are storing their data and making their data available in ArcGIS Online. And if that data is available on ArcGIS Online, you can bring it into a tool like this.

So we have another project called FutureWater. That's been supported by the Environmental Resilience Institute. And that has data that's hosted here on the IU ArcGIS Online environment. I'm just going to go get that data. I just copy the URL, and I'm gonna place that URL in here and add it to my map, and when we will be able to pull in the FutureWater data.

And if I wanna get that watersheds name for 2020s for the 4.5 scenario, here are your results for FutureWater. I don't have a lot of time to really go into these variables for FutureWater. I would, I guess recommend you look at FutureWater and see how you could use this data, but this is one way to do that.

Another one well documented, we have another project called the Hoosier Resilience Index. And it too has most of its data housed within ArcGIS Online. Again, I can just copy that layer and add it to my map, and now I have what the FutureWater data in there in addition to the, I'm sorry, the Hoosier Resilience Index data in there in addition to the FutureWater data.

And this gives us how many days of above high heat days or low heat days, etc, etc. So these different datasets are used in standalone applications that highlight their specific data. But once that data is stored up in formats like this, it can also be brought into tools like these.

One last thing on the bring your own data tab, if I zoom in to a specific area and I'm looking for geospatial data, IU has a repository of spatial data through the Indiana Spatial Data Portal. If I zoom into a particular area, and I say, Indiana Spatial Data Portal files, it will take the extent of where I was there, and then give me all the data available.

So if I wanna download some orthophotography for that specific area, or if I wanted to get some additional data from. Past historical data sets, all of the data that's stored on the Indiana Spatial Data Portal is queried and you have access to it through a tool like that.

So, one final thing I want to bring up is the select screenshot area and some measurement tools. So if I wanted to, let's say go in and measure a cite for some field work or something, I could actually go in here and get a 3D measurement instead of those 2D measurements that are normally on a straight looking down map.

This has given me an elevation contour from this point to this point, 465 meters. If I wanted to draw that polygon, I can do so and this is a 3D polygon and let's say I wanna put that in acres, there we go. I'm looking at a 49 acre parcel, but that 49 acre parcel is now showing you a 3D measurement instead of a measurement that's only using 2D.

So you can see, if I measure from this point over to here, it's a straight line instead of following the topography of the land. So this is a really good way to do some advanced measurement anywhere on the globe. And it will show you that flat line, this hillcrest goes above that 3D plane, that is measured this 49 acres.

And then, if I really like what I'm doing here, I can select a screenshot area and say, give me a screenshot of that and it'll download image. And now I've just created a screenshot of that area and I can save it to or send it to. All right, that was a whirlwind tour of the ERI data platform viewer and I only have a couple of minutes I wanna wrap this up by noon.

So, if I can ask any or if I can answer any questions or answer any questions offline, I'd be happy to do so in the next couple of minutes. Otherwise I would like to take this opportunity to thank you all for participating, this is a really nice turnout and great presentations.

And I thank you so much for all those that have presented and shared what they've been doing. With that, I'll turn it over if there's any questions. Great, I threw all that at you and there are no questions, I must have done a great job. Okay thank you again everyone for your participation and I think we can close it up.


>> Thank you. BLANK_AUDIO]