Downscaling Climate for Indiana

Modeling climate scenarios for Indiana

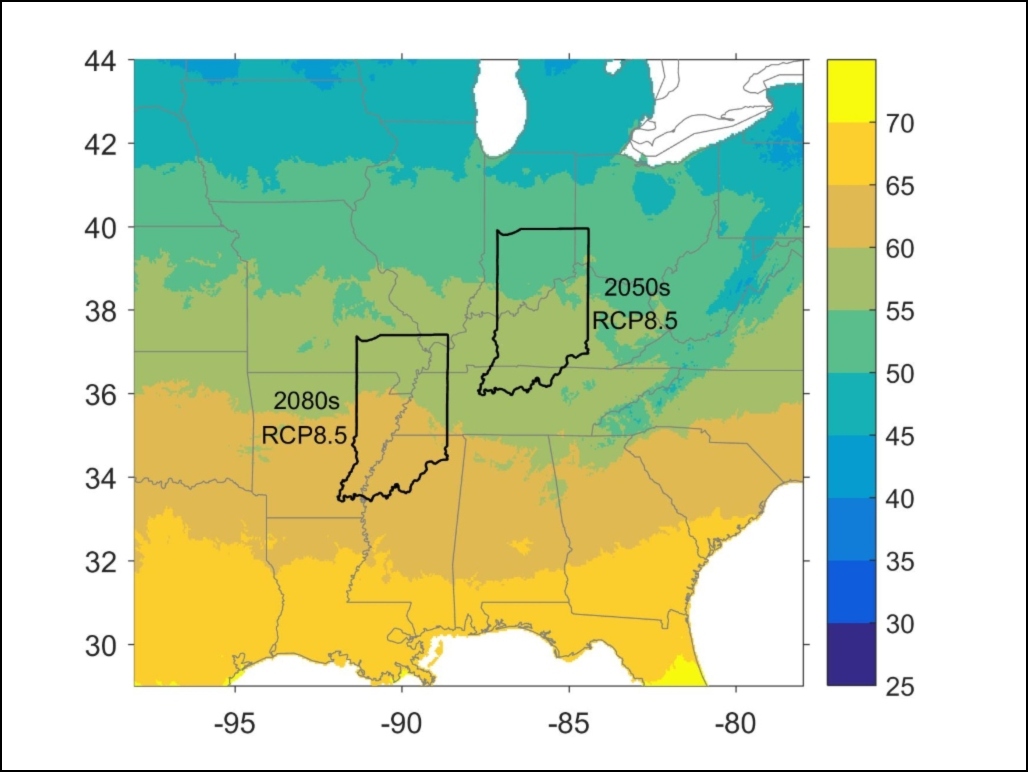
Under future emission scenarios, Indiana in the 2050s would have a climate similar to the current climates of more southern states. Graphic courtesy of the Indiana Climate Change Impacts Assessment

The Problem

Climate models play a key role in guiding world governments as they enact plans to mitigate and adapt to climate change. Climate modeling centers around the world routinely release updated global-scale climate models that allow scientists to better project the severity of future climate impacts, depending on how quickly humans mobilize to reduce carbon emissions. These models, however, are not good at telling us about how weather patterns are likely to change at smaller scales in places like Indiana and the Midwest, limiting their usefulness for state and local decision makers.

The Project

To provide more precise climate projections pertinent to Indiana communities, businesses, and policymakers, IU Assistant Professor Ben Kravitz and his team are “downscaling” global climate data using IU’s Big Red 3 supercomputer. Whereas global climate models, such as those used by the Intergovernmental Panel on Climate Change (IPCC), simulate future climate on a grid with cells about 100 kilometers wide, the downscaled data produced by Kravitz’s team uses a grid of 3 kilometers in width. This allows the team to make much more detailed projections relevant to Indiana and neighboring states, using a model that is tailored to the Midwest.

To date, the team has completed downscaling of the IPCC’s high-emissions scenario—a scenario in which little to no progress has been made in reducing global greenhouse gas emissions—and analyzed it for information relevant to Hoosiers’ health and the state’s economy. Using the downscaled data, the team has found that this worst-case scenario could lead to an average annual temperature increase of about 10 degrees Fahrenheit in Indiana. The model also projects annual precipitation to remain consistent but with greater seasonal shifts, with more rain in winter and spring and less rain in summer and fall. The model shows, however, that the amount of extreme precipitation events (3-4 inches or more in a day) could increase and the rainiest day of the year could include about 33% more rain by 2100, the end of the timespan the team projected.

The Path Forward

The team will continue analyzing its high-emissions scenario data to determine changes in season lengths, length and frequency of droughts, and length, frequency, and intensity of heat waves. Researchers are currently downscaling a medium-emissions scenario as well, which is roughly consistent with the world’s progress to date on reducing greenhouse gas emissions. The team is publishing a paper on the methodology behind its downscaling technique so that other communities can replicate it.

Updated Feb. 16, 2022

Project Data

The data for this project consists of a dynamically downscaled and bias corrected dataset at 3 km horizontal resolution over the Midwest region, covering the period 1951-2100 under historical and RCP8.5 conditions.

Data is produced using a regional model (WRF 3.9), driven by NCEP/NCAR reanalysis 1 and CESM1 simulations designed for downscaling with WRF. Data provided includes temperature (T2) and precipitation (PRECIP). 

IU ScholarWorks hosts additional information on project data.