Understanding Energy Insecurity among Indiana Households

Confronting energy hardships during uncertain times

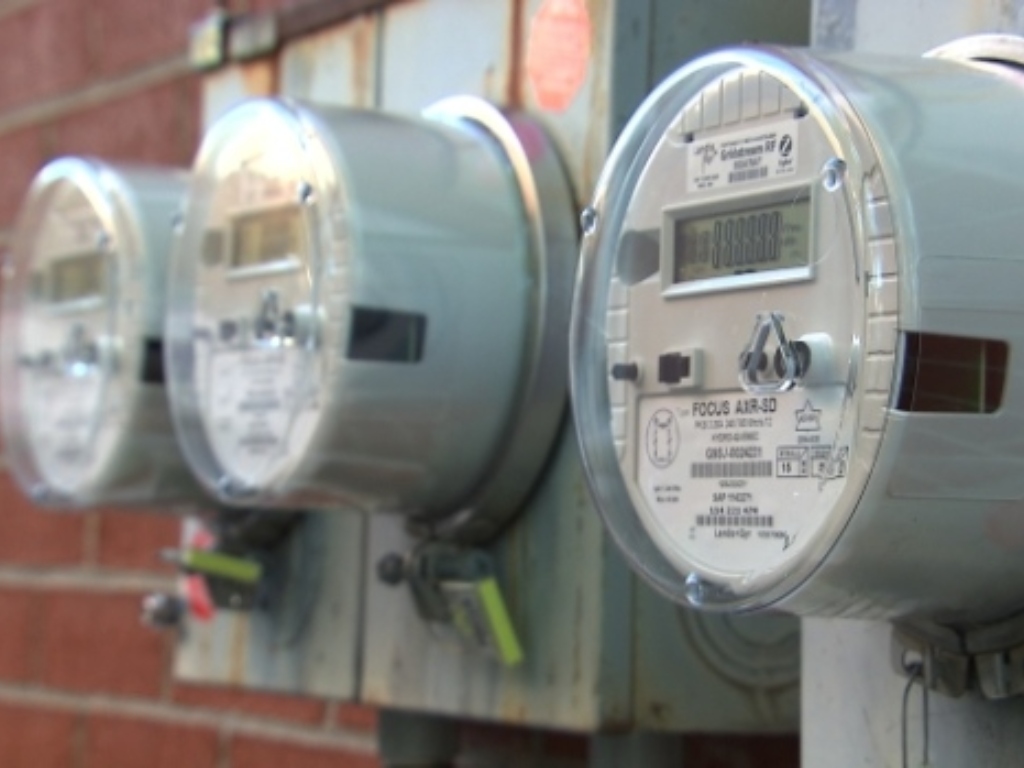
Electric meters against a brick wall

The Problem

Energy insecurity—the inability to pay an energy bill—is a widespread problem among low-income households in the United States. When households are unable to pay for their energy needs, the mental and physical well-being of household members is likely to suffer. The problem is exacerbated by disruptions to the labor market, increases in energy costs, and extreme weather, among other factors.

The economic shock of the COVID-19 pandemic pushed millions of Americans into energy insecurity despite efforts by state and local governments to protect households that have fallen behind on utility payments. Understanding the magnitude of this problem and the shared characteristics of these households is essential to addressing this growing problem.

The Project

Throughout 2020, IU researchers conducted multiple surveys to assess the impact of COVID-19 on household energy insecurity. National and Indiana-specific surveys were conducted in multiple waves to assess how fast-changing economic conditions affected Americans’ abilities to meet their household energy needs.

After two rounds of national surveys, the team found that 20 percent of households could not pay an energy bill, nearly 15 percent received an energy shutoff notice, and about 7 percent had their service disconnected. National findings suggest that around 3.8 million Americans could not pay an energy bill in at least one month in 2020, 2.8 million received a shutoff notice, and 1.2 million have had their electricity disconnected between May and August 2020. Responses from Hoosiers indicate that Indiana’s energy insecurity experiences generally reflect the rest of the country.  

Survey results also reveal disparities in who has been affected most by the pandemic’s economic fallout. Responses indicate that low-income Black and Hispanic households were around two to five times more likely to face energy insecurity compared to low-income white households. Additionally, households with young children, households at or below the poverty line, and households with a member who relies on a medical device were more likely to be energy insecure.

The Path Forward

In 2021, the team is conducting an additional round of surveying to capture households’ energy security status as the pandemic and government policies evolve.

The results will further help answer questions such as what assistance people are seeking, whether they are aware of available options, how much debt people are accruing, how energy debt compares to other forms of debt, and what activities people are forgoing because of their energy insecurity.

Once researchers have conducted and analyzed their latest surveys, they plan on creating a dashboard analyzing US energy disconnections to bring more transparency to this issue.

Updated May 25, 2021

Project Data

The research team is collecting data through multiple surveys over time. See below for more information on how they are conducting the surveys and what data is being produced.

The research team is collecting survey data from respondents on how the COVID-19 pandemic has impacted their energy security.  

The research team is working with a partner firm called YouGov to conduct the surveys. The surveys are in an online format through representative samples using a matched sample methodology. Wave 1 (May 2020) of the national survey consisted of 2,381 responses, followed by 2,247 in Wave 2 (August 2020), and 1,672 in Wave 3 (January 2021) and around 2,000 people filled out the Indiana survey. Wave 4 of the national survey will be administered in May 2021.

The data contains variables capturing respondents who could not pay their energy bill, who received a shutoff notice, and who had their energy disconnected. Those variables were then compared by race, income, employment status, gender, number of children and elderly individuals, medical device usage, and job status.

The data is in CSV files and displayed in charts.

Preliminary results from the first three rounds of the surveys are available online. Once all the data has been collected and analyzed it will be made publicly available. The team is also looking into creating an interactive map of the data.