Environmental Resilience Institute researchers are gathering, analyzing, and disseminating data that illustrates how Indiana's environment is changing. On this page, users can view data tools and resources curated and created by ERI.
Sharing environmental change data for Indiana
ERI Data
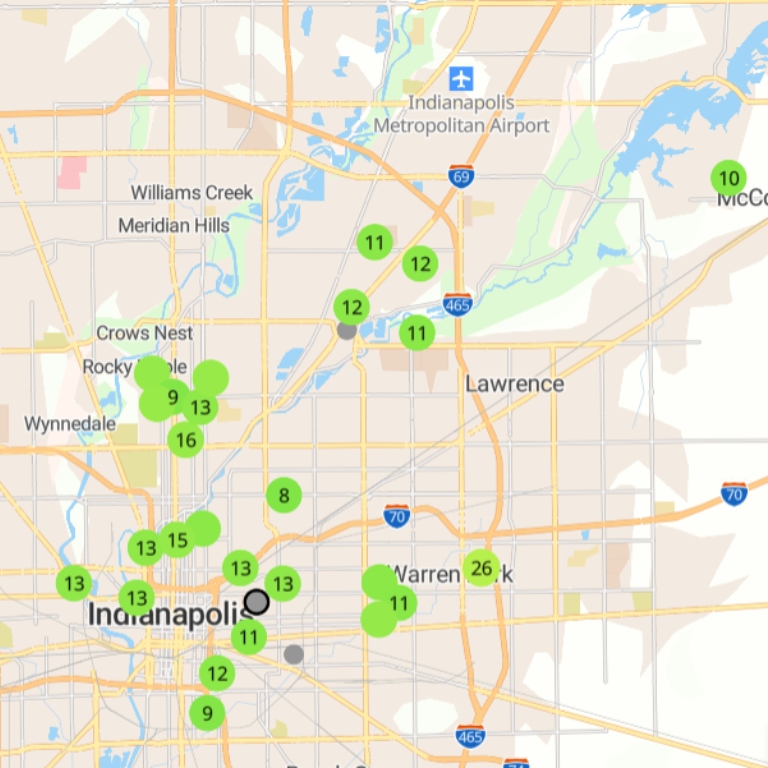
Air Quality in Indianapolis
Project lead: Gabriel Filippelli
View real-time results from an Indianapolis-based network of air quality monitors managed by ERI researchers. The network is part of a global open-data air quality monitoring effort.
View air quality data
FutureWater
Project lead: Chen Zhu
How will water resources in Indiana change by 2100? This Science Gateway allows users to view surface water forecasts for the Wabash River Basin under different global carbon emissions scenarios to see projected changes in precipitation, soil, and waterways.
View FutureWater data
Hoosier Life Survey
Project leads: Matthew Houser and Eric Sandweiss
The Hoosier Life Survey (HLS) is Indiana’s most comprehensive statewide public-opinion survey on environmental change. From the HLS Opinion Map page, users can view high-level survey results and in-depth analysis on how Hoosiers perceive and respond to environmental change.
View HLS data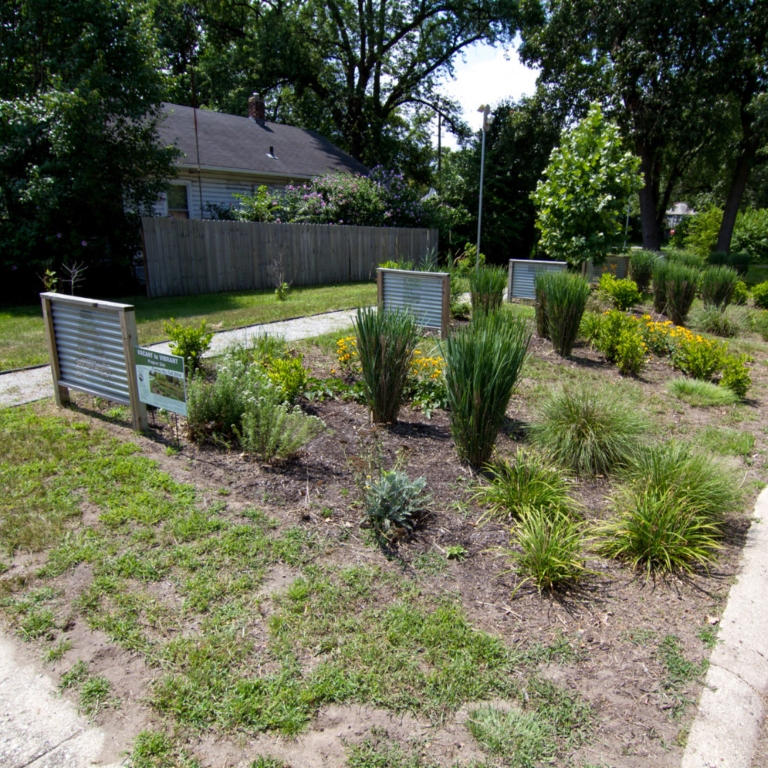
Indiana Green City Mapper
PROJECT LEAD: HEATHER REYNOLDS
Researchers have created a spatial database of urban green infrastructure, socioeconomic data, and climate change data in Indiana. The data can help municipalities mitigate climate change impacts and better address social needs.
View the databaseWildlife Tracking
Project lead: Ellen Ketterson
MOTUS towers track bird movements and migration patterns to help researchers understand how wildlife is adapting to environmental change. This ERI research is part of an international effort, with active stations around the world.
View wildlife tracking data
Project Vector Shield
Project lead: Keith Clay
Researchers conducted a multi-year surveillance program to monitor the presence of ticks and mosquitos in Indiana. The dataset paints an updated picture of the presence of disease vectors in Indiana.
View project vector shield