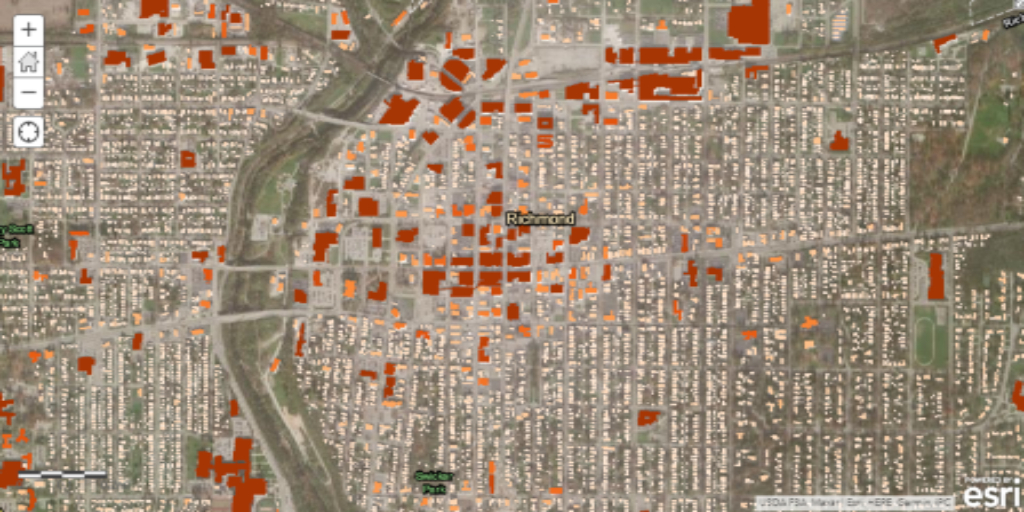
Richmond Solar Power Potential Map

Outcomes and Conclusions

The solar power potential map provides useful information the City can use as it tries to increase the community’s solar energy production. The map visually illustrates the feasibility and suitability of adding solar panels across town by identifying the roof’s slope, orientation, and estimated solar radiation per building. For example, the larger roofs in suburban areas had more solar generation potential than those in urban areas because of roof size.

Overall, this project was inexpensive and easily reproduceable. The City of Richmond is excited for the platform to assist neighborhoods transitioning from fossil-fuels to on-site solar energy as a method for reducing greenhouse gas emissions community-wide. In June 2021, the City published the finalized solar map on their website. 

Challenges

The map developer reflected that there were few technical challenges throughout the project. Internet connectivity issues sometimes caused tools to crash and the program to restart, delaying processing time.

Staff also found that while the instructions from the ArcGIS lesson were intuitive enough, previous GIS experience was helpful to replicate the project for the Richmond community. Furthermore, the project can be more or less difficult depending on the amount of detail, geographical scale, and size of the area being analyzed.

Takeaway Message

Matt Evans, the GIS Coordinator for the City of Richmond, gave the following advice:

"This data provides powerful insight for our local government and individual property owners to better understand the possible solar energy production on rooftops across Richmond. This process is reproducible across Indiana thanks to easily accessible statewide GIS data and should be usable by many communities with GIS capabilities.” 

Questions for discussion

These questions are designed to inspire readers—especially those wanting to learn broadly about climate change solutions—to think critically about the case study on this page and encourage deeper, more meaningful conversations. A list of ERIT case studies that include discussion questions can be found on the Resilient Communities Case Studies page.

  1. Visit the City of  Richmond’s Solar Map.
    1. What are the four datasets included in the map?
    2. What are some suitable areas for rooftop solar radiation?
    3. What areas are not suitable?
  2. What are strategies to alleviate rising temperatures and increased precipitation in urban areas?  

For more information about developing a solar power potential map, contact:

Matt Evans
GIS Coordinator
Department of Infrastructure and Development, City of Richmond
mevans@richmondindiana.gov