Sustainable water resources in Indiana in a changing world

Predicting water access and sustainability

An example of an output from the interactive data portal. Image courtesy of FutureWater.

The Problem

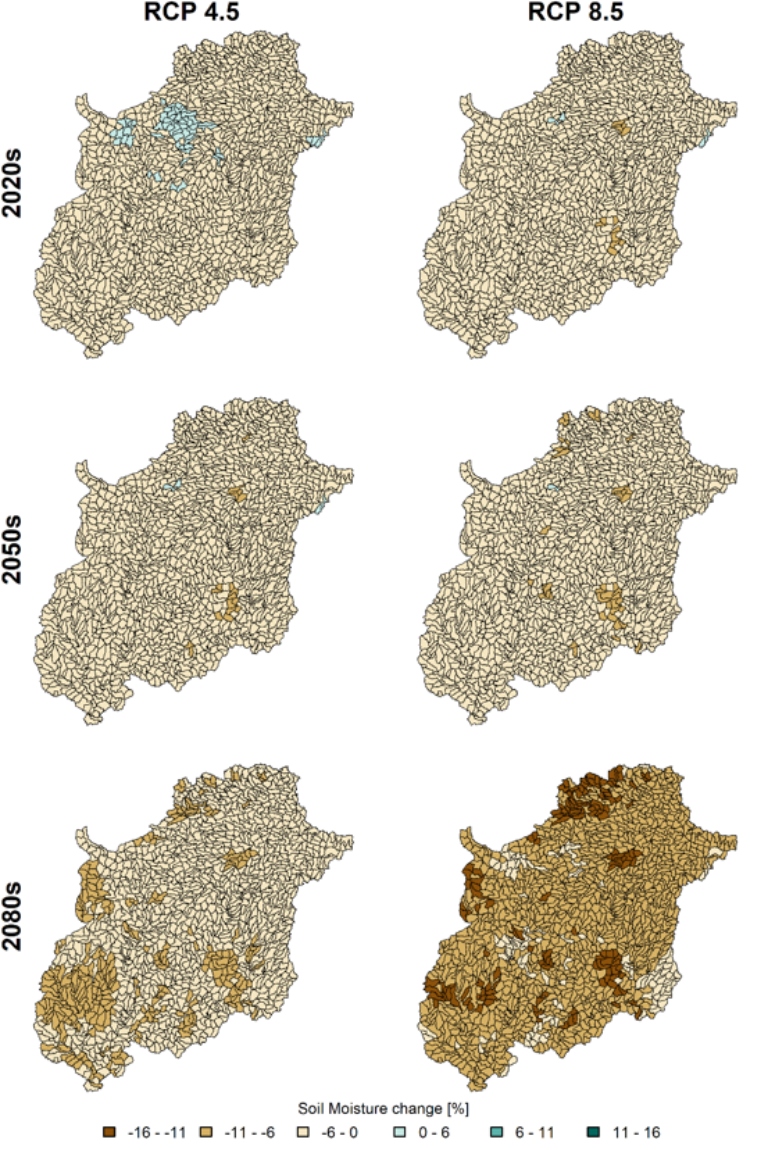
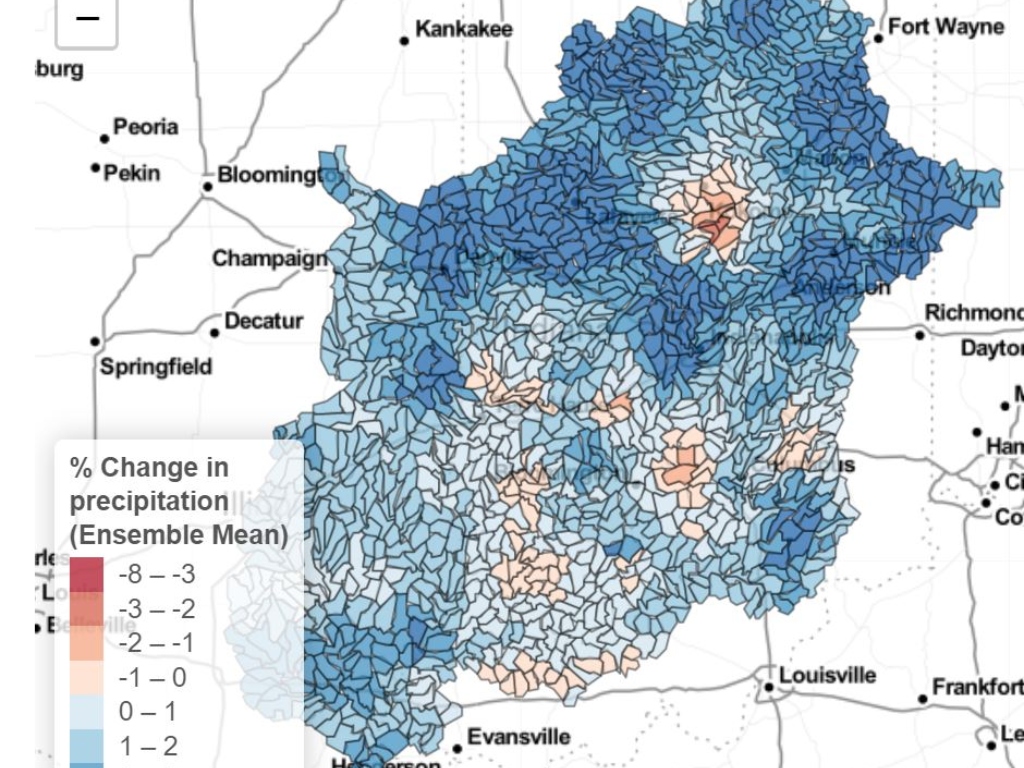
Indiana climate scientists have projected the state is likely to experience more hot days, wetter springs and winters, drier summers, and more extreme rain events because of climate change. However, how these changes will impact Indiana’s water supply is not well understood. With a substantial part of Indiana’s economy dependent on water, predicting future water availability for Hoosier farms, businesses, and communities is vital.

The Project

To project future water availability in Indiana through 2100, IU researchers created a model of the Wabash River Basin, which covers about two-thirds of the state. The research team developed the model using an ensemble of climate models provided by researchers at the University of Notre Dame, hydrological modeling software developed by the U.S. Department of Agriculture, and datasets encompassing Indiana's elevation, land use, land cover, soil types, and streamflow. The research team developed the regional-scale watershed model on IU’s high-performance computing infrastructure, including Big Red series supercomputers.

The results of the model show that increasing temperatures due to climate change are likely to reduce the amount of water in Indiana’s soil and streams over time, despite modest projected increases in average annual rainfall. The takeaway: Indiana’s soil and streams will likely be drier for longer periods of the year in future decades.

Furthermore, seasonal shifts in precipitation could become an additional stressor on Indiana surface water, as periods of rain in the winter and spring and periods of drought in the summer and fall become more common.

The Path Forward

To promote collaborative research and inform water stakeholders throughout the state, the research team created the FutureWater science gateway, a public, interactive data portal that allows users to explore the team’s Wabash River Basin model under various scenarios. The science gateway allows users to conduct their own analysis, update the existing model, or run entirely new models. Beyond water management, the data could help advance solutions in agriculture, wastewater treatment, land use, and species migration, among other applications.

With the initial model complete, the research team is collaborating with the U.S. Geological Survey to incorporate projections for Indiana groundwater supplies and nutrient runoff in an updated version of its hydrological model. This inventory will give researchers a better understanding of the groundwater supplies in the state and a better assessment of nitrate and arsenic contamination.

Updated Feb. 16, 2021

Project Data

FutureWater ran 10 models to analyze how climate change would impact surface water levels of the Wabash River Basin over time. The team then created a public, interactive data portal to display the results.  

Through model simulations, the researchers produced watershed data on water availability through the year 2100 under medium- and high-emissions scenarios in the Wabash River Basin.

The team used a Soil and Water Assessment Tool (SWAT) hydrological model. They input datasets, including topography, subbasins, soil properties, and land use/landcover, that were compiled from multiple governmental agencies. The team then calibrated the model using observed stream data and a multi-criteria objection function.

The data represents precipitation, evapotranspiration, soil water content, groundwater recharge, baseflow, streamflow, and water yield. The variables are looked at over annual and monthly periods for the 2020s, 2050s, and 2080s under medium- and high-emissions scenarios.

The data is formatted in a spreadsheet and as an interactive interface. The interface can be used to explore maps, graphs, and tables of projected climate change impacts on the hydrology of the Wabash River Basin. The data can be viewed at different subwatershed sizes and by zip code allowing users to see graphs of the percent change over time at any location in the watershed.

The data is available on the FutureWater science gateway. Users can view the data in the interactive data portal, or they can download the .csv files.